Ethereum USD has continued its strong start to 2026, holding steady above $3,300 as a different kind of buyer steps in to take control of the chart. Price strength held even as leveraged retail traders exited, a rare combination in crypto rallies.
Zooming out, this move aligns with a broader 2025 trend in which long‑term holders and institutions replace short‑term speculation, as ETH has climbed by more than +10% since the beginning of the year.
ETFs and publicly traded Ethereum Treasury firms have been the main drivers of ETH’s strength in recent weeks, as institutions and DATs race to secure their share of the Ethereum staking yield, creating organic demand for the number two digital asset.
Why Ethereum’s Rally Looks Different in 2026
Most crypto rallies start and end with leverage, which is borrowed money used to bet on short‑term price moves. Think of leverage like using a credit card to buy stocks. It can boost gains fast, but forced selling hits hard when prices wobble.
As recently as October 2025, the crypto market suffered a historic crash when more than $19Bn in leveraged long positions were liquidated, causing a complete reset, which 99bitcoins reported on at the time. Ethereum dropped from $4,600 to $2,700 over the subsequent five weeks.
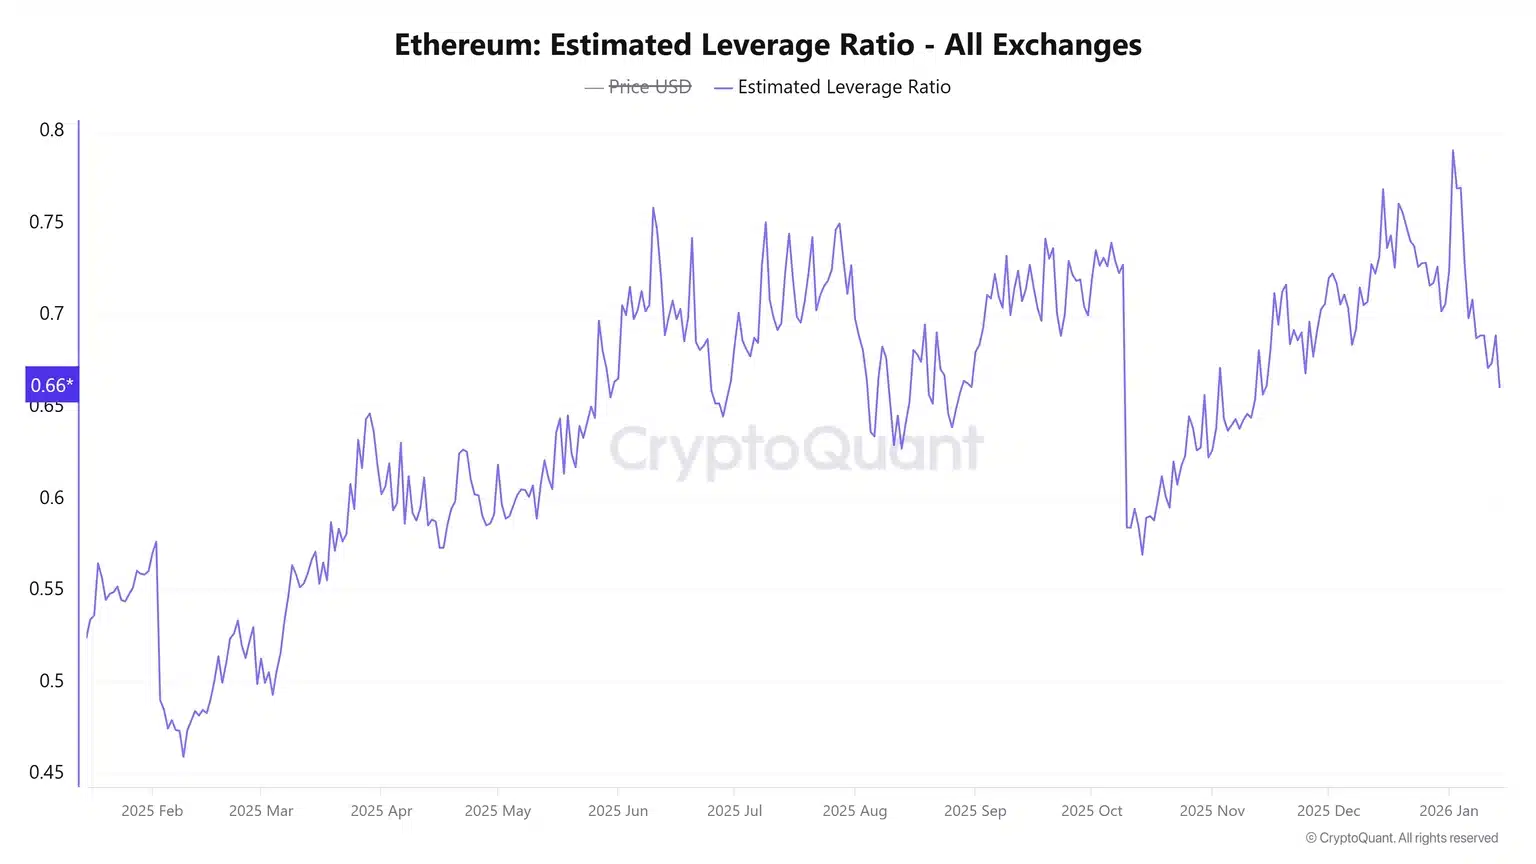
This time, data from CryptoQuant shows Ethereum’s estimated leverage ratio is falling. At the same moment, spot buyers stepped in. Spot buying means people pay cash and actually own ETH, like buying gold bars instead of trading gold futures.
That matters because spot buyers tend to hold. Looking at the chart below, when the leverage ratio fell from 0.65 in April 2025 to below 0.60, Ethereum USD surged from $1,600 to $2,700 by June, underscoring that a drop in the leverage ratio often leads to significant price spikes for ETH.
(SOURCE: CryptoQuant)
EXPLORE: The 12+ Hottest Crypto Presales to Buy Right Now
Institutional Demand Is Doing the Heavy Lifting for Ethereum USD
US investors played a big role in this move. Spot ETH ETFs recorded record inflows of $175M on January 14 for 2026 so far, marking their fourth consecutive day of positive flows, according to CoinGlass data. ETFs matter because they allow traditional investors to buy Ethereum USD without using crypto wallets.
At the same time, ETH balances on exchanges dropped to seven‑year lows. Fewer coins on exchanges means less “ready‑to‑sell” supply. Picture a store with empty shelves. Prices usually rise when scarcity increases.
nearly every major ethereum on-chain metric is at record highs.
and it’s not by luck. Fusaka was a huge upgrade to ethereum scaling.
glamsterdam upgrade will further scale ethereum in various different ways, including the ways nodes process data.
very hard not to be bullish.
— Joseph Young (@iamjosephyoung) January 15, 2026
And speaking of Ethereum scarcity, over 29% of the total ETH supply is now locked in the native staking contract, as institutions are taking advantage of the 2.8% APY on offer. 21Shares, Bitwise, Coinshares, and Grayscale all have staked Ethereum ETF products, with BlackRock also filing for its own last year.
Coupled with Ethereum treasury firm Bitmine and its staking spree of over 1M ETH, valued at over $3.3Bn, it is clear that institutions are driving the Ethereum USD price action.
This aligns with a broader narrative we’ve tracked at 99Bitcoins. Analysts already call 2026 Ethereum’s year, as ETFs, long‑term holding, and, most importantly, staking are working together to tighten supply.
What This Means for Everyday ETH Holders
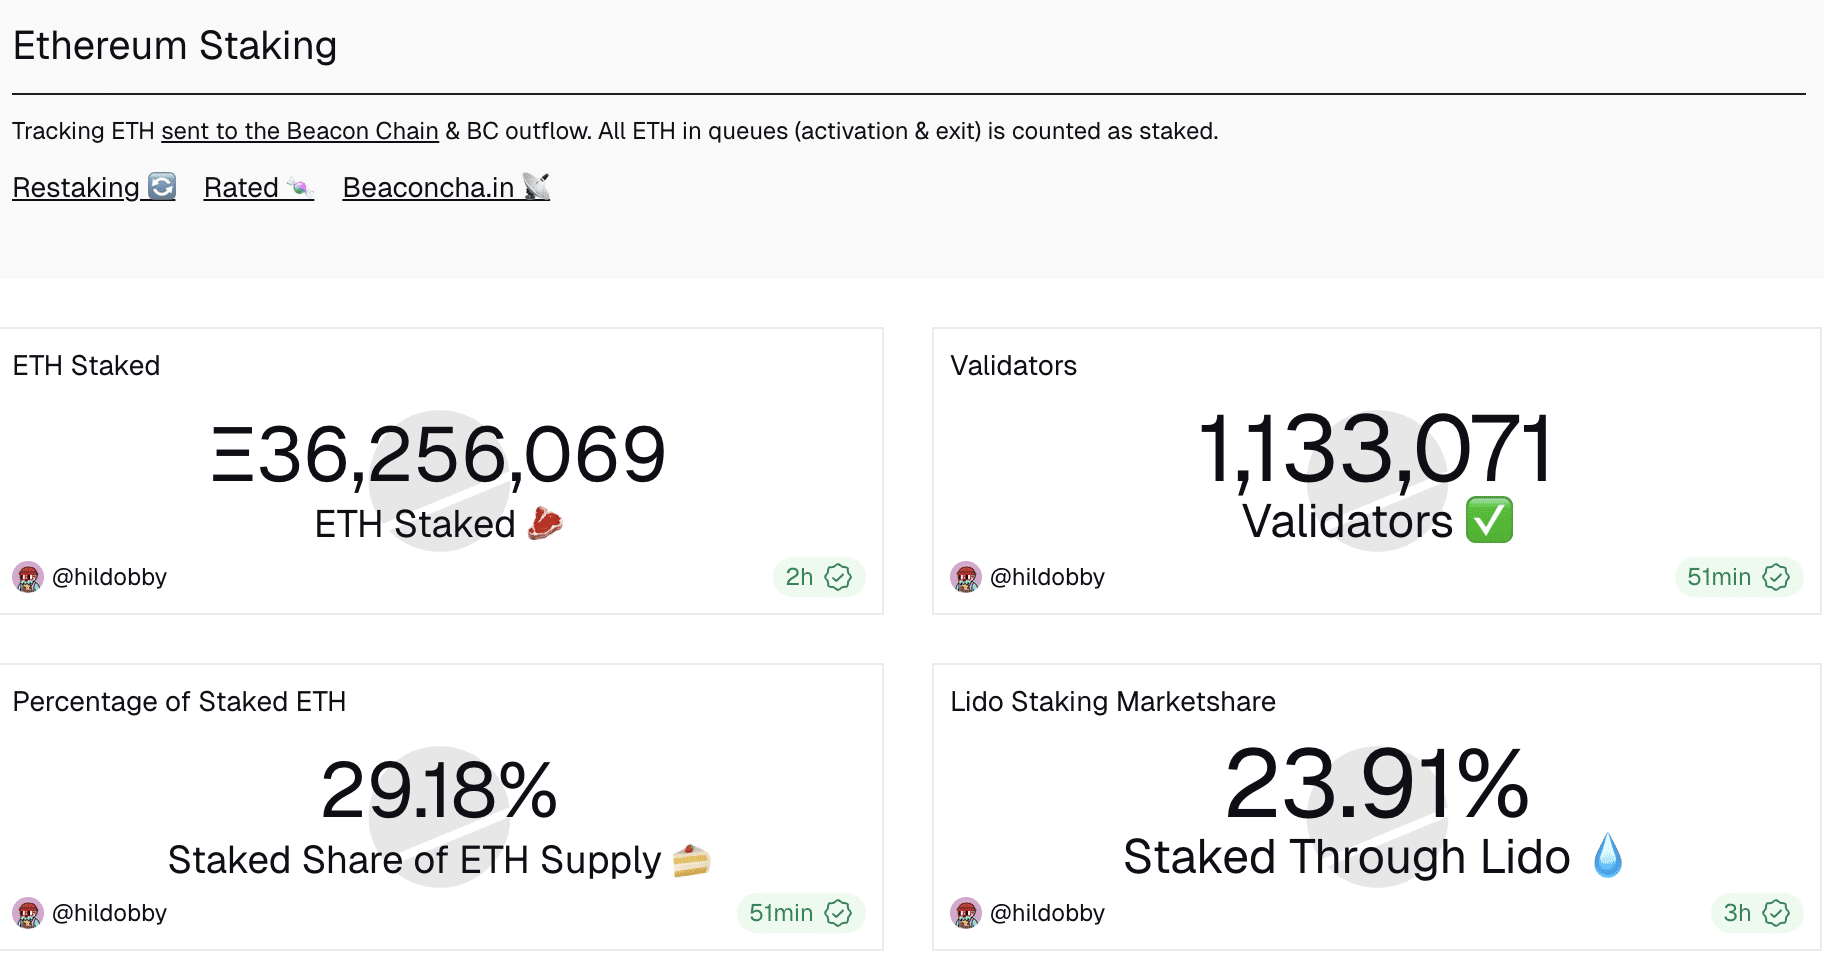
(SOURCE: Dune Analytics)
For beginners, this shift reduces one major risk. Leverage‑driven rallies often crash fast. Spot‑driven moves tend to grind higher with fewer violent drops.
It also explains why ETH often holds gains better than smaller coins. Ethereum sits at the center of DeFi and staking. Staking is like earning interest by locking ETH to help run the network. Nearly 30% of the total ETH supply is now locked, as we covered when Ethereum staking hit an all‑time high.
Still, this is crypto. Volatility never disappears. ETH dropped sharply earlier in 2025, even after ETFs launched, underscoring that timing matters and that, despite increased institutional adoption, risks remain.
Risk Check: What Could Go Wrong?
Spot demand slows if macro conditions tighten. Rate hikes or stock market stress can pull money out of risk assets quickly and should always be a consideration when investing.
Competition also matters. Chains like Solana attract institutions looking for speed and lower fees, but recent upgrades to Ethereum are making it more competitive than ever. That’s one reason analysts debate whether Ethereum can outperform Bitcoin over the long term, as explored in our piece on Ethereum catching up to Bitcoin.
Bottom line. This rally shows stronger hands in control. If spot buyers stay active, ETH’s floor looks firmer. Just remember, never invest money you can’t afford to watch swing 20% in a week.
DISCOVER:
- 16+ New and Upcoming Binance Listings in 2026
- 99Bitcoins’ Q4 2025 State of Crypto Market Report
Follow 99Bitcoins on X For the Latest Market Updates and Subscribe on YouTube For Daily Expert Market Analysis.
The post Ethereum USD Climbs as Institutions Step In and Retail Traders Step Back appeared first on 99Bitcoins.
