Shiba Inu price is on the verge of a bullish reversal, as momentum picks up after the recent SHIB burn, with a potential for 25–35% gains from current levels.
Summary
- Shiba Inu price has formed two higher lows and a higher high since the October 10 flash crash, reclaiming the 7-day SMA and nearing a 7/20-day bullish crossover.
- A confirmed breakout above $0.00001129 could open the path toward $0.00001250 and $0.00001400 — representing roughly 20% and 35% potential gains from current levels.
Shiba Inu price technical analysis
Shiba Inu (SHIB) recently conducted another token burn, removing 54,846,282 SHIB over the past week, representing 76% increase compared to the previous week, according to the October 27 announcement. Despite the lack of an immediate bullish price reaction — with SHIB currently experiencing a modest pullback after printing a higher high at $0.00001069 — the technical structure is showing early signs of a potential reversal.
The daily chart now displays two consecutive higher lows since the October 10 flash crash, followed by a higher high. The price has also reclaimed the 7-day SMA and sustained multiple daily closes above it. The memecoin is now testing the 20-day SMA, while the 7-day SMA appears poised to cross above the 20-day, which would confirm the first meaningful short-term bullish crossover — if it sustains — since early September.
What’s next for Shiba Inu price?
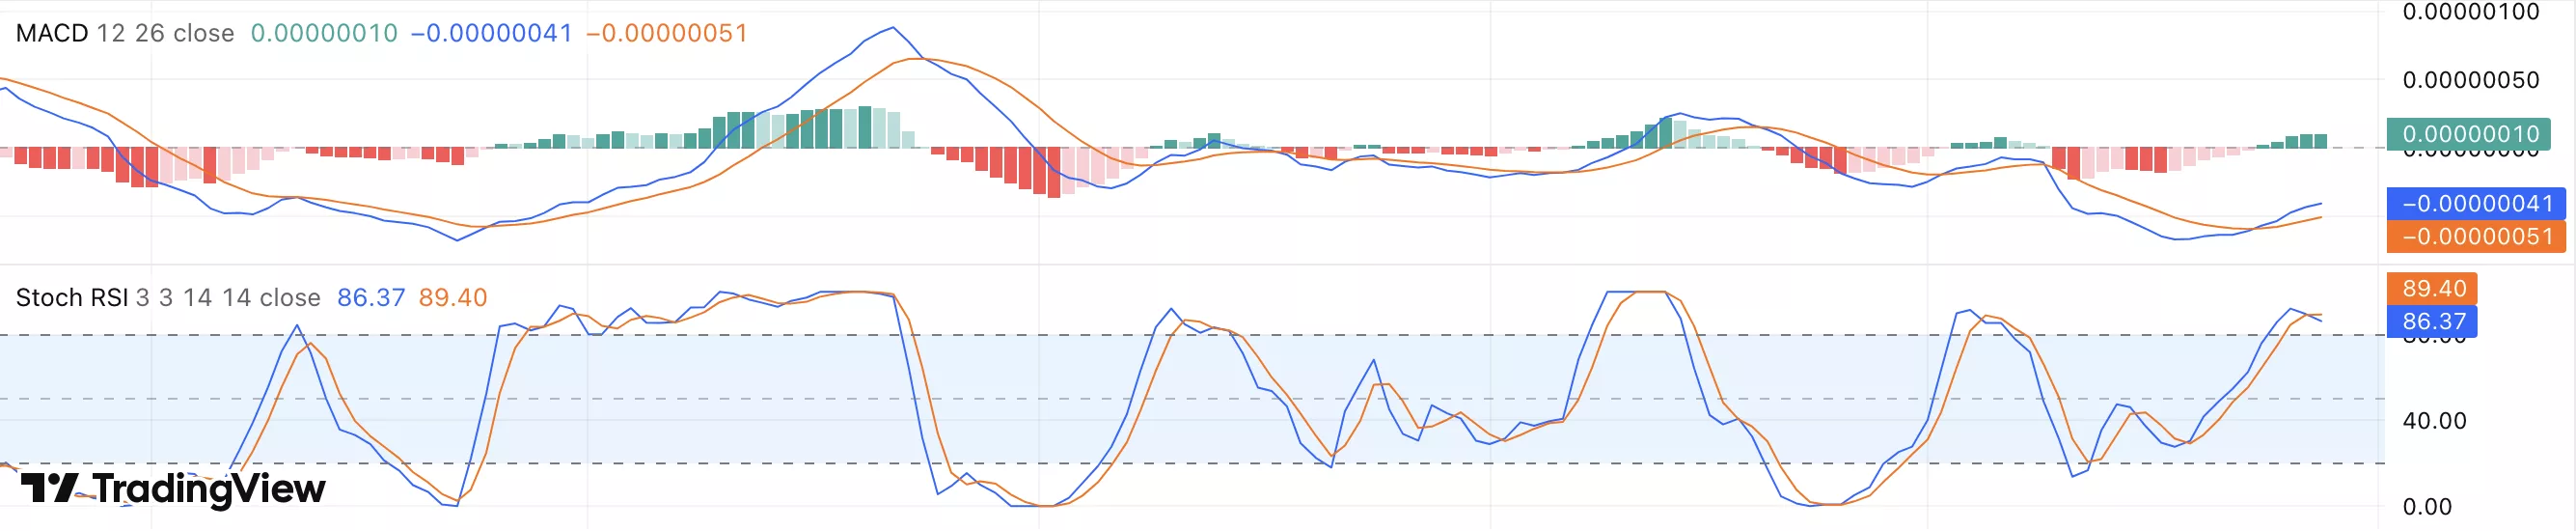
The Stochastic RSI is retreating from overbought levels, suggesting a short-term momentum reset. A pullback toward the $0.00001000–$0.00000990 support zone would be constructive if it holds, as it would establish a higher low. The MACD indicator has completed a bullish crossover, signalling that bullish momentum is building.
For the bullish structure to further strengthen, Shiba Inu price needs to confirm higher low and then break above the post-crash recovery high at $0.00001129, which would confirm continuation of the short-term uptrend and open the way toward the next Fib resistances at $0.00001250 and $0.00001400. Reaching these levels would mark approximately 20% and 35% gains from the current price, respectively.
