Hedera Hashgraph’s native HBAR token has fallen before several key thresholds on multiple time-frames on Thursday as the global crypto markets pulled back to $2.35 trillion. With the monthly stats for March now calculated in the exchange-traded fund (ETF) field, it figures that HBAR maintained a positive inflow of $2.12 million throughout the month.
HBAR Gains Steady On Wall Street: No Price Impact?
This makes HBAR ETFs the fourth most successful on the traditional stock markets in March, 2026, as many bigger altcoin counterparts pulled back. Namely, Ethereum (ETH), Ripple (XRP) & Litecoin (LTC) Spot market price-tracking ETFs saw multi-million deficits, with Ether ETF taking the cake at $46 million in outflows, according to SoSoValue.
Meanwhile, Hedera’s HBAR-based ETF items saw stagnant trading activity on most business days, but managed to shield itself from consecutive large outflows. This puts cumulative ETF inflows for HBAR at $94.27 million – a figure considerably smaller than XRP’s $1.21 billion in garnered inflows, yet larger than DOGE, LTC & AVAX all combined.
With HBAR Network’s status as a Distributed Ledger Technology (DLT), the 2026 narrative has been compliance-first. Hedera’s DLT technology is well positioned towards bank integration, is currently tested by SWIFT for cross-border payments & has a solid big-tech line-up in the council established by the Hedera Foundation.
Futures Data Unveils The Real Truth Behind Price Dip
But the price appreciated is clearly lacking – technical analysts now point to $0.098 as a pivotal checkpoint. If that doesn’t hold, the next support zone lies at $0.0785, based on the Fibonacci Retracement levels displayed in the HBAR price analysis below. On the big-time crypto player side, the confidence in a local bottom isn’t there yet.
The uncertainty reflects on crypto whale movement trends too. With the Chaikin Money Flow (CMF) dwelling below zero on multiple time-frames, Futures data looks just as bearish in the near-term. Judging from the CoinGlass real-time data, HBAR bulls accounted for $174K out of $184K in liquidations, sending over-leveraged Futures investors into capitulation.
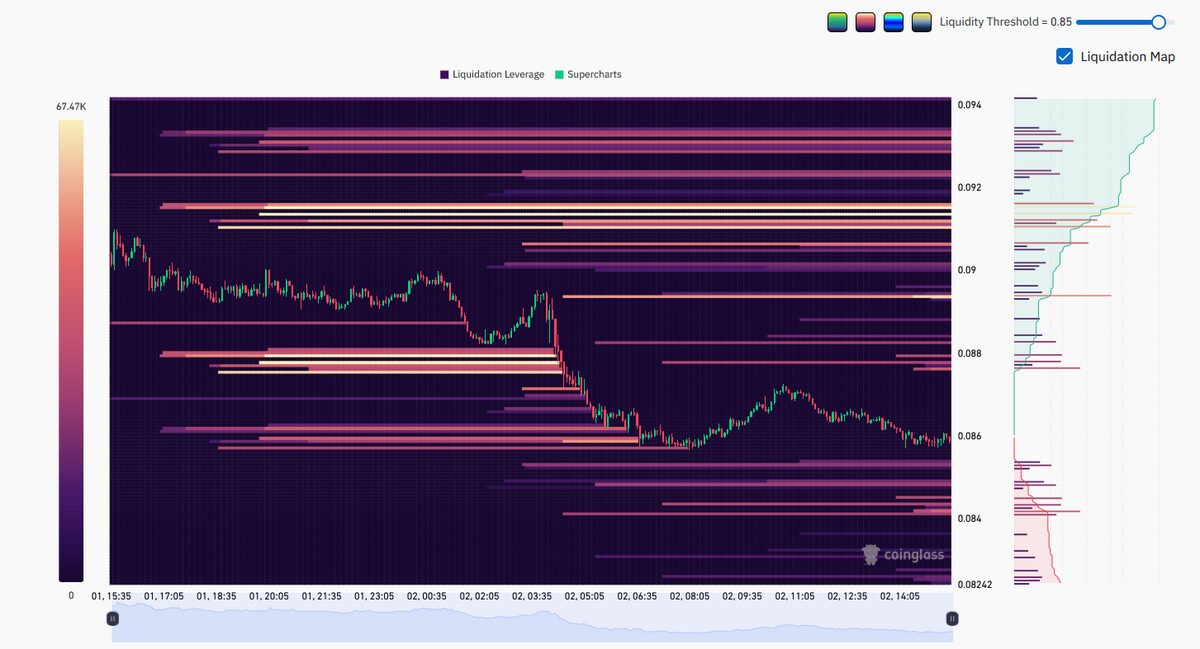
The most sensitive HBAR price area for liquidations remains between $0.090 & $0.092, according to the heatmap. Notably, the 24-hour long versus short ratio has plunged to 0.94, meaning that short-sellers outscore HBAR bulls by accounts, while Binance’s customers remain the most bearish on Hedera’s price at just 0.71.
If the current $0.0850 price falls back to the $0.0785 key support territory, another huge leverage bubble between $0.087 and $0.088 would be cleared – a technical sign of a local bottom. Conversely, the Fibonacci Retracement level breakdown suggested a restoration of bullish dominance if the OG altcoin recoups $0.0098.
Stay in the loop with DailyCoin’s top crypto scoops:
Bitcoin Whales Flip to Sellers As Market Faces Maximum Pain
$285M Drift Exploit Sends Solana DeFi into Risk-Off Mode
People Also Ask:
In the March 2026 US Spot Crypto ETFs report, the HBAR ETF saw +$2.12 million in new money coming in. Among altcoin ETFs, this quietly put HBAR in 4th place for inflows.
While Bitcoin and Solana dominated the big inflows, HBAR came in strong among smaller altcoin ETFs — behind Solana and Chainlink but ahead of Dogecoin, Avalanche, and Polkadot.
HBAR is still in a longer correction with lower highs and lower lows. It recently bounced off Fibonacci support, but the overall structure is still weak until it breaks higher.
The big level to watch is $0.098. A clean break above this would be the first real sign that the downtrend is ending and a reversal could start.
Positive ETF inflows are a good long-term sign (more big investors buying in), but the price still needs to prove itself by breaking $0.098.
DailyCoin’s Vibe Check: Which way are you leaning towards after reading this article?
