BTC USD took a heavy hit in early trading, plunging to the $63K level and leaving a trail of wrecked portfolios in its wake. In a sudden market flush, traders longing for Bitcoin saw over $295 million wiped out in hours. If you have been nervously watching your portfolio turn red and feeling a knot in your stomach, you are definitely not alone.
The sudden drop to $63K has traders asking the hard questions: Is this just a temporary leverage flush, or the start of a deeper correction driven by global economic fear?
The market is testing the nerve of every retail investor right now.
DISCOVER: Next 1000X Crypto: 10+ Crypto Tokens That Can Hit 1000x in 2026
BTC USD Price Drops To $62,700: What Now?
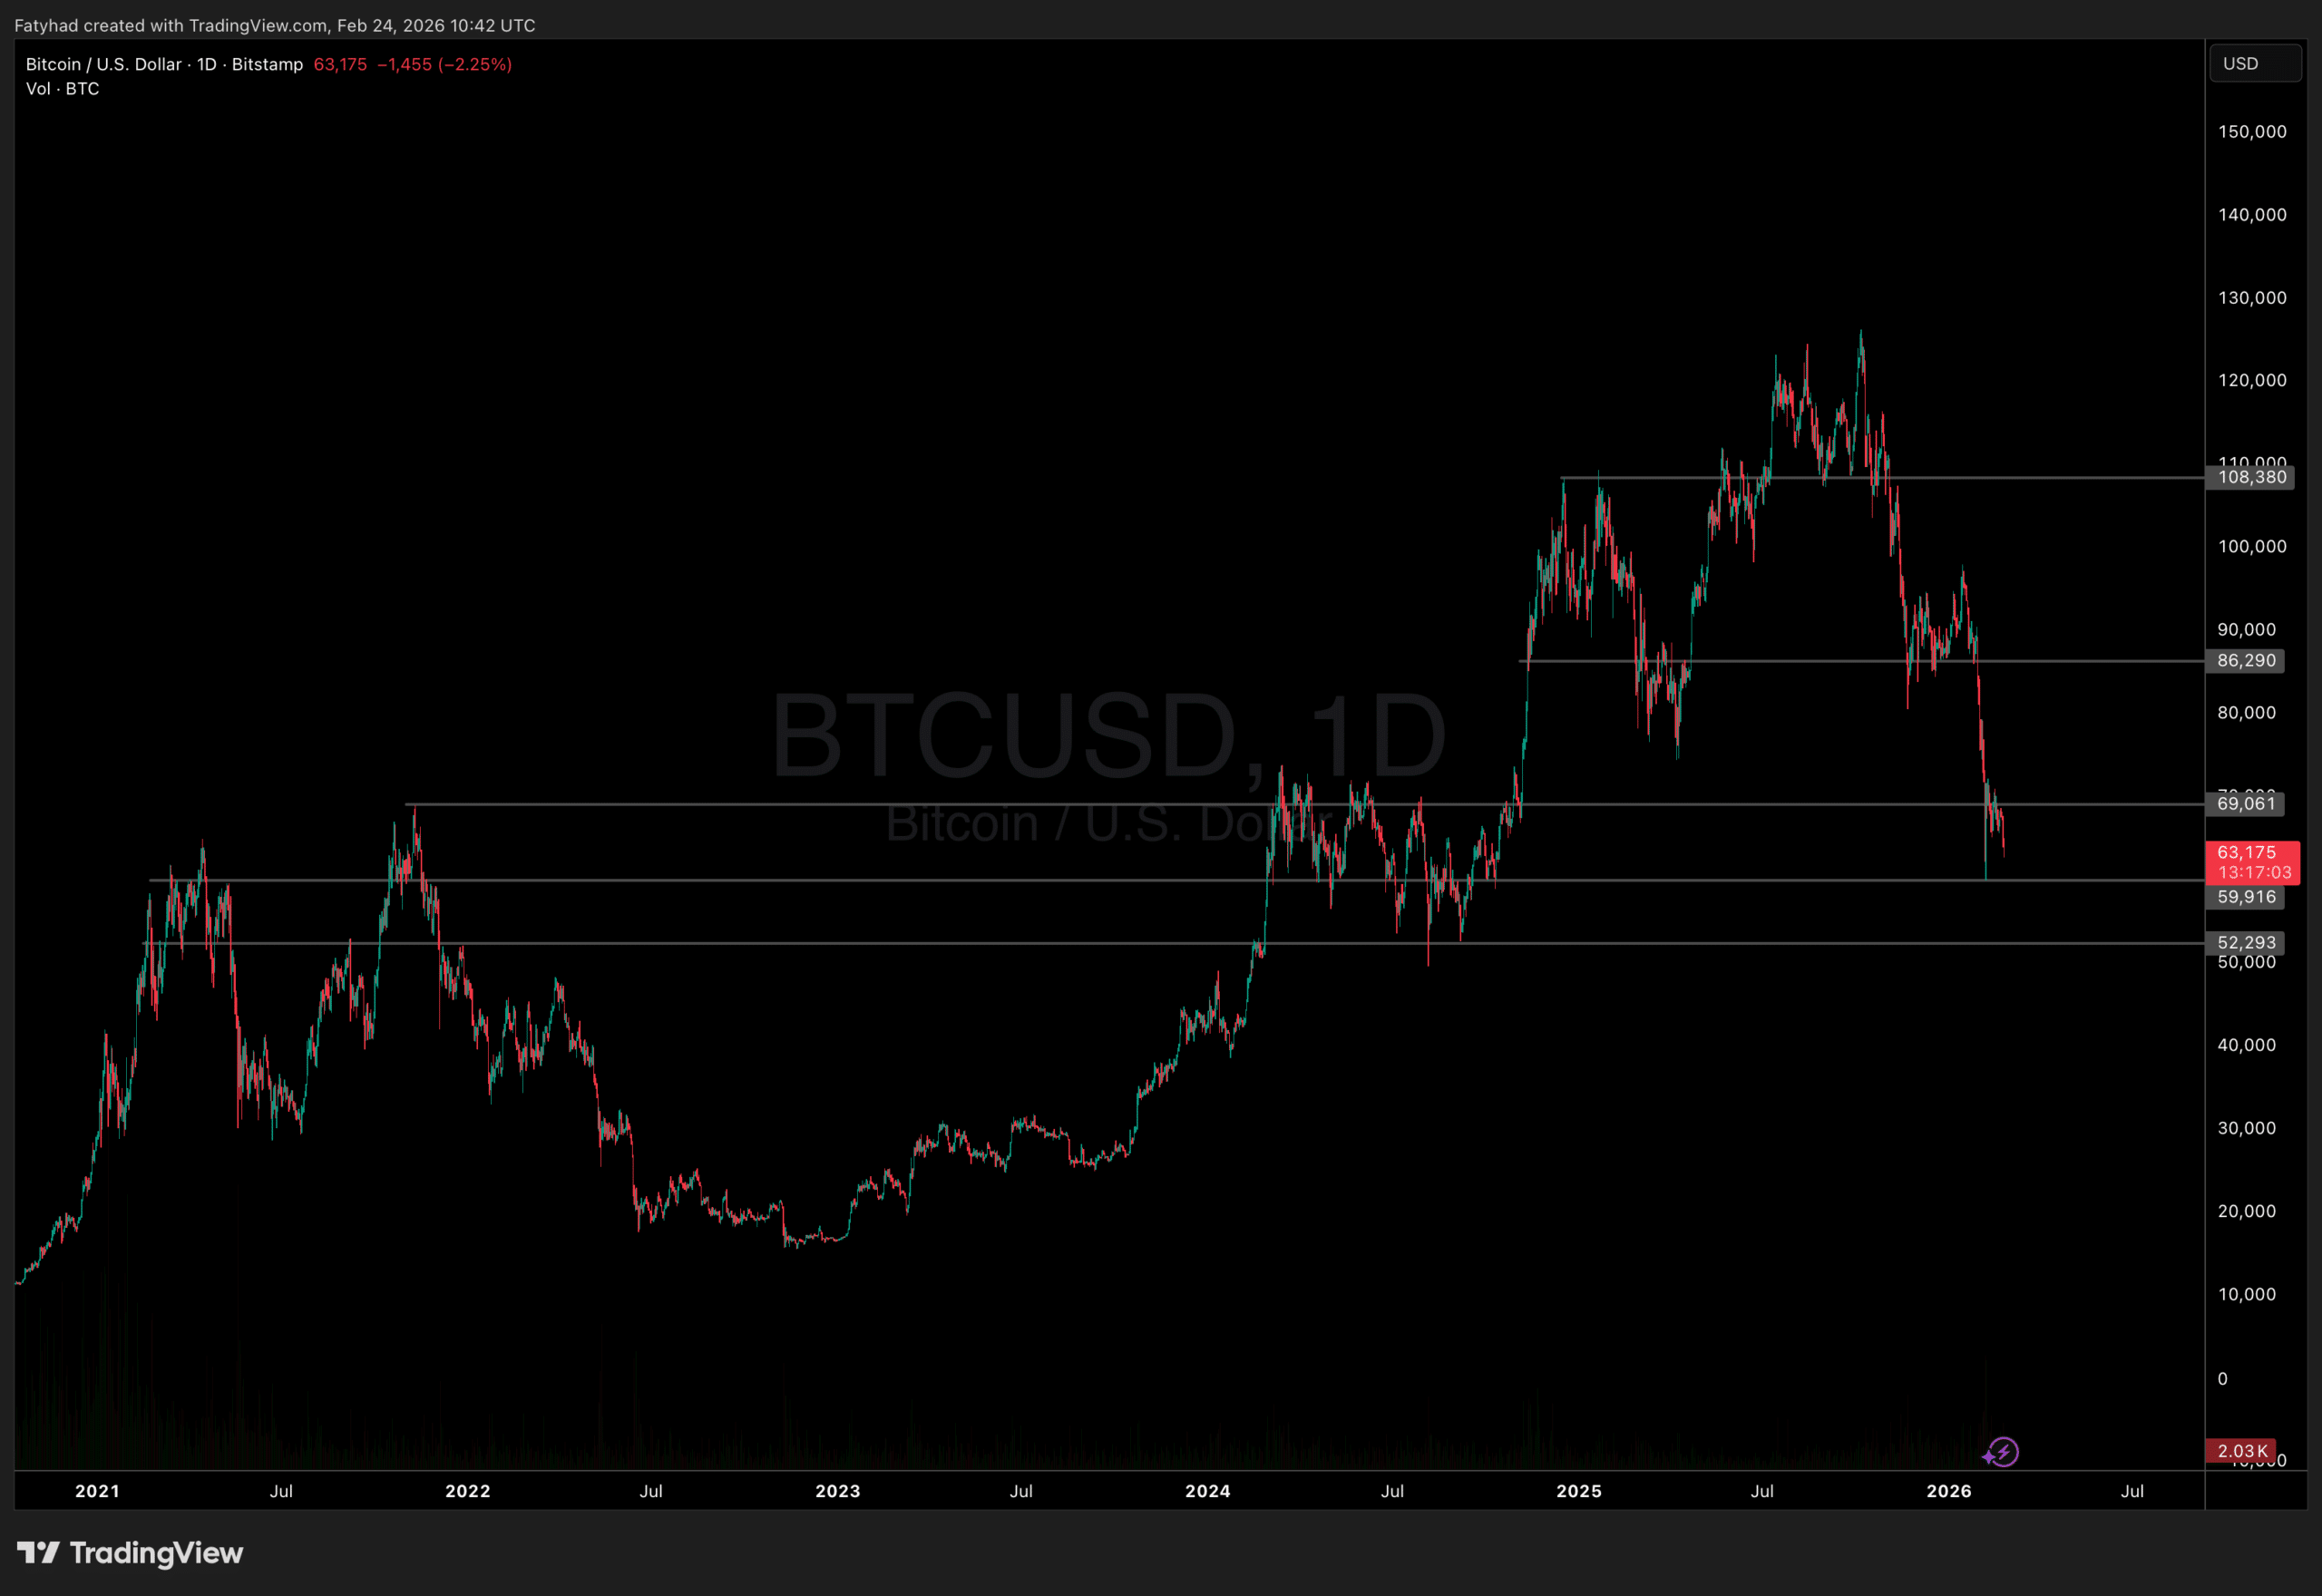
Bitcoin price crumbled under heavy selling pressure, breaking through support levels to hit a low of $62,700. BTC has fallen over 19% in February, marking its worst monthly performance since June 2022, and is down roughly 50% from its October 2025 all-time high near $126,000. Why the dramatic price action?
Escalating U.S. tariff tensions, geopolitical risks (including U.S.-Iran concerns), and macro uncertainty pressured risk assets like stocks and crypto.
Tech sector weakness: IBM’s 13%+ plunge, its worst day in 25 years, after AI announcements triggered an AI-driven selloff that spilled into crypto.
ETF outflows and liquidations: Sustained institutional outflows from Bitcoin ETFs (over five weeks) and $370 million+ in leveraged position liquidations amplified the drop.
DISCOVER: 16+ New and Upcoming Binance Listings in 2026
Traders on Kalshi See 90% Probability Bitcoin Hits Sub-$60K Low This Year
JUST IN: 90% chance Bitcoin falls below $60,000
— Kalshi (@Kalshi) February 24, 2026
Prediction markets are flashing red, with U.S.-regulated platform Kalshi assigning a staggering 90% probability to Bitcoin dipping below $60,000 at some point in 2026, based on trader bets in its yearly low-price contract. Short-term odds are more tempered, around 45% for a sub-$60K breach by February 28, but the annual forecast aligns with technical warnings of further downside.
Analysts see $60,000 as a pivotal psychological and Fibonacci support level; a break could accelerate selling toward $56,000–$58,000 (near the 200-week EMA), mid-$50,000s (like $54,800 from bearish patterns), or even $42,000–$50,000 in a severe pullback.
While some see this as tactical risk management in the face of global challenges, the combination of market catalysts and prediction odds paints a concerning picture for Bitcoin bulls. This suggests prolonged consolidation unless sentiment changes.
DISCOVER: Best New Cryptocurrencies to Invest in 2026
Follow 99Bitcoins on X For the Latest Market Updates and Subscribe on YouTube For Daily Expert Market Analysis.
The post BTC USD Drops To $63K: $295 Million in Longs Liquidated appeared first on 99Bitcoins.
